This course includes several topics to help you get up to speed regarding using computers and digital technology for research. It is expected that you may already know some of the topics well. However, since different people have much different areas of knowledge and expertise, several different basic areas are included. Just use what you need (or are assigned if a student).
You probably won’t need to learn everything in this course, at least not initially. So pick and choose to read and lean what you immediately need first, then learn the other stuff as you have time. Further, this course won’t explain everything. If you need to know more, do what professionals do: a web search!
Table of Contents
- Computer Environments, Applications and the Internet
- Using spreadsheets
- Plots
- Unix and Linux
- Inexpensive Linux Computer: Raspberry Pi
- The command line
- Graphing with R
- Creating a web page with HTML
- Styling a web page with CSS
- Programming Concepts
- Scripting in JavaScript
- PHP programming to support simple web graphics
- Arduino Prototyping Controller
-
1. Computer Environments, Applications and the Internet
Chances are that you are on a computer if you are reading this, so you obviously know how to use one. However, there are some aspects of the computing environment that deserve review because being aware and understanding them will help you figure out the unintuitive aspects of various tools.
Operating Systems
An operating system allows the parts of a computer to communicate with each other, especially for naming and organizing files in memory devices such as RAM, disks, and now, the cloud. There used to be three major operating systems: DOS/Windows, Mac OS and Unix, all on desktop computers. Now the situation is much more blurred, but you still need to be able to sort it out. There are versions of operating systems for personal computers (desktops and laptops), mobile devices (phones and tabled), and the Internet of Things (your refrigerator, television set, etc.). There are also de facto operating systems for the cloud, but that is beyond the scope of this work. We will be working with recent versions of the operating systems. You should know that Macintoshes are now really just a nice graphical user interface running on Unix. Thinks that look like Windows machines either often are running a Unix equivalent called Linux, or can run Linux. Much software development these days is performed on Unix or Linus systems, even if intended for Windows machines.
Applications
If you want to do more than just copy and move files around, you will need to use applications. Word processors, spreadsheets and web browsers are applications.
Command Line
Often, to have sufficient power over your computer, you need to speak with it directly. That means using a tool called the command line. You use a program that seems like an old-fashioned computer terminal, and type lines of words, numbers and symbols in it, often one line at a time. Cumbersome? Yes. Powerful? Incredibly!
Graphical User Interfaces
Graphical user interfaces (GUIs) let you access applications (and even the operating system) by using visual interfaces, typically shown in windows. For example, you are reading this in a graphical window. Important! GUIs often have several elements which you will need but can sometimes be hard to find. There is often a tool bar at the top of the screen, but there may also be a toolbar at the top of the window or in other partsof the screen or window. If you can’t find what you need in one toolbar, look for other toolbars. Sometimes the toolbar will be hidden until you click on a symbol or word. Panels contain useful information, and additional controls and tools. Panels are often hidden, and require clicking on something to show up, or choosing a command in a tool bar or pulldown menu.
The Internet
The internet connects your computer to the rest of the world. However, rarely do you want the rest of the rest of the world looking at your computer. So you will create content on your computer, and you will use a secure, publicly accessible server (or the cloud) to host your content. Web browsers are the most common way for people to view content on the internet. Therefore, you may be writing web pages and other tools for people to view your content the way you want them to access and view it.
Programming
Although there are application for writing web pages and performing calculation, sometimes you will need capabilities that they cannot adequately provide. So you will need to write your own program or application. To do so, you will need to use a programming language. While each programming language is different, most have certain elements in common. Once you learn about and understand those elements, then it will be easier to learn additional languages.
-
2. Using spreadsheets
It is obvious that spreadsheets can perform calculations. It is less obvious that they can be used for the same purposes as many simple computer programs.
There are several common spreadsheet programs, such as Microsoft Word, Apple Numbers and Apache Open Office. They all have most of the features you will need, but eventually you may find that each one has particular strengths and weaknesses.
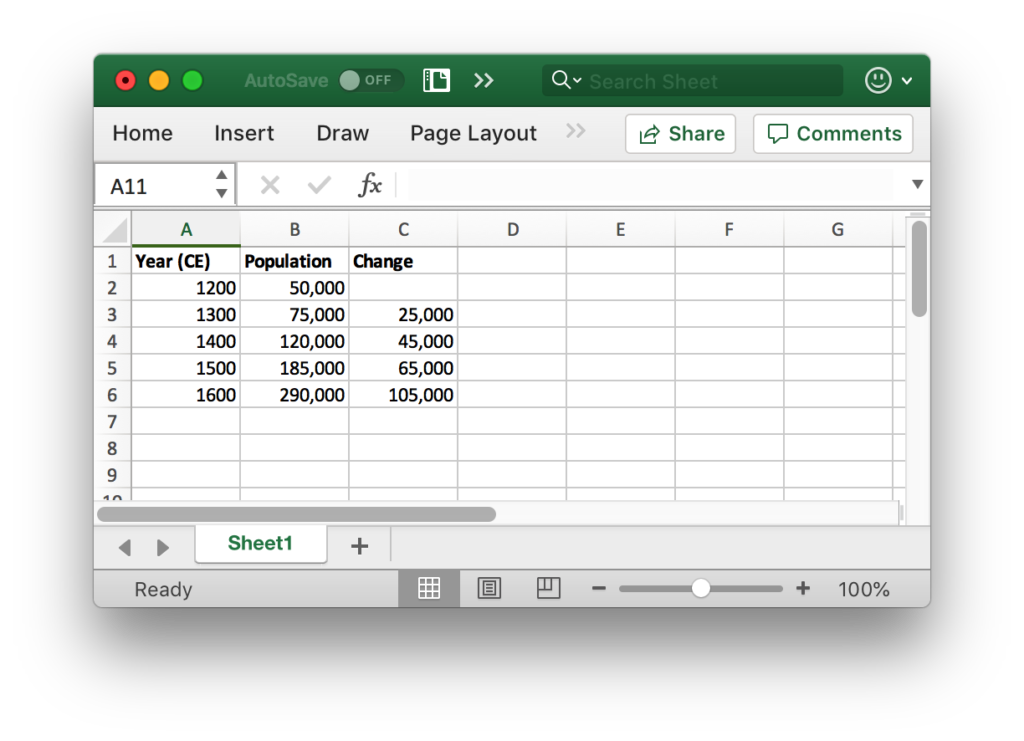
Spreadsheets can easily store data such as numbers and words. The power of the spreadsheets, however, is in their ability to perform and update calculations by changing the contents of just a few cells. Below is shown an example of a simple spreadsheet.
How To Use Spreadsheets
Spreadsheets comprise a grid of cells, and can be thought of as rows and columns. Spreadsheets provide tremendous flexibility in the way that they are used. You simply enter numbers and other information in whatever arrangement you wish. There are nevertheless some best practices.
If you will be entering a list, such as names of persons or places, it is best to use on row per list item. Then you can use columns for information about those list items. For example, the first column could contain names of people, the second column cod contain their birth years, and the third column could contain the place of birth. If you use only one row per list item, and use the same column for each type of information, then you can process the data much more efficiently.
Regarding learning the commands and procedures for using a spreadsheet, it is best to view a tutorial that specifically concerns the database platform you use.
Spreadsheet as a Calculator
The advantage of using a spreadsheet as a calculator is that you can save both your calculations and results. Further, you can change just a little bit of information to calculate many different scenarios, instead having to re-enter the entire calculation each time.
Spreadsheet as Database
A spreadsheet can be used as a simple database. Each row can represent a record (such as for a person or country). Each column can represent a field such as population or location.
If you are careful about being consistent and using each column for the same type of information, you can then export your spreadsheet data to a real database, if needed. If you are inconsistent, then considerable clean-up may be required. In the above spreadsheet example, the second column titled Population an en example of stored data.
Spreadsheet as a Program
A spreadsheet can carryout many redundant calculations. For example, if you wanted to run an annual simulation for one hundred years, you simply create a column for each year, with the necessary calculations. Series features and copy-pasting make this relatively easy. The third column titled “Change” in the above spreadsheet comprises calculated values over time.
Spreadsheet Software
There are several different spreadsheet applications, offered by different companies and organizations.
- Google offers a free spreadsheet. It is easy to share online, but it is somewhat limited in capabilities.
- Open Office is free and runs on several platforms.
- Apple offers Keynote, which comes free with many Macintosh computers, and is fairly complete for basic uses.
- Microsoft Excel costs money, but has the most commands and packages available, although it is not as easily shared online as the Google spreadsheet application. Educational and other discounts may be available for Excel. We will use Excel for most purposes.
-
3. Plots
Plots (also called graphs) are a way to visualize data. The most common plot involves two perpendicular coordinates, and dots, or symbols representing the data. Line(s) may be plotted to indicate a trend through such data.
Plots are typically used to show relationships between items of data or factors. Most plots are two-dimensional, being the easiest to visualize on a computer screen and print on paper. So they typically show a relationship in data or a simulation between two factors. It is possible to have more dimensions or factors, but more complexity can make a plot more difficult to understand.
There are some easy-to-use free or inexpensive graphing programs. For example, Grapher is included with most Macintosh computers. Such programs are good enough to visualize many mathematical functions. However they are insufficient to plot data or output graphics for scientific uses.
Good plotting software can be a bit expensive for those on low budgets. Fortunately, MS Excel is good enough for most purposes, often supplied under site licenses to entire schools and universities, and offers a graphical user interface. For more sophisticated or customizable plotting, the R language and environment are free, but require know a little coding (fortunately there are lots of free online guides for the basics).
Types of Plots
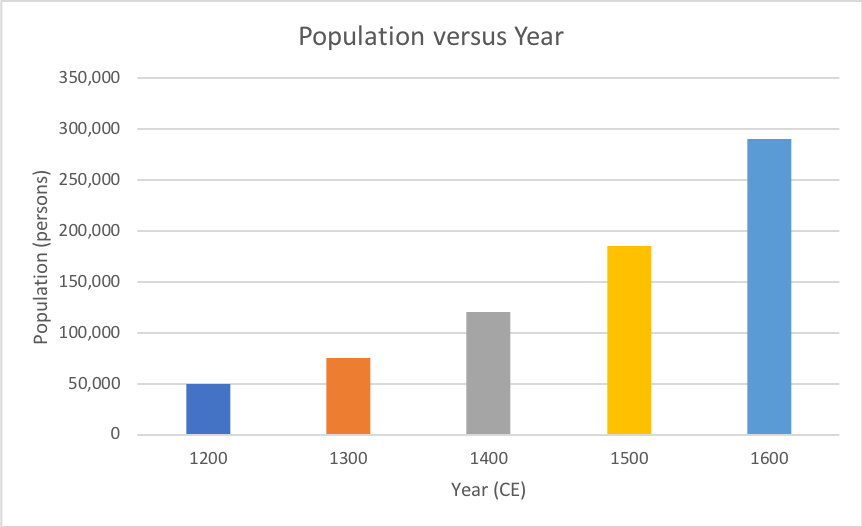
There are several types of plots. A common type is a column plot (shown below). Column plots are easy to understand and are thus popular for presentations. The magnitude of each data item is simply the height of the column.
An example of a spreadsheet with data
Another type is the scatter plot (shown below). A scatter plot allows more data points to be shown, and is good for either comparing numerous relationships, or for comparing a set of data points with a model or predictions.

Microsoft Excel plots of various rates of exponential growth
-
4. Unix and Linux
If you are serious about using the full capacity of computers for research, you will need to use Unix or Linux. Unix is an operating system developed in the 1980s by the Bell Labs (the research operation of the old AT&T telephone company). It isn’t super easy to learn or use, but once you do learn it, Unix is often to most efficient and powerful way to accomplish tasks on a computer.
All Apple Macintosh computers that run system 10 or later actually run Unix as their operating system. However, their is a graphical user interface (GUI) on top of the operating system, so most Mac users never have to directly interact with the Unix layer. However, the application Terminal does let you talk to the Unix layer.
Some older MS Windows machines run a language that is a little bit like Unix called DOS (Disk Operating System). DOS is very useful for those machines, but it is not ad widely used for research as Unix. (DOS can have some advantages when working with hardware, but that is beyond this lesson). Fortunately, most MS Windows machines can run a variant of Unix called Linux. It is possible to install Linux on a machine that also runs Windows and have “dual boot” machine that can run either operating system. (Setting up a dual boot machine can wipe out your existing files, so don’t do it unless you really know what you are doing, and back up everything first).
It is also possible to run only Linux on some computers. On other computers, such as the Raspberry Pi, it is possible to run only Linux.
Unix is typically run from a command line utility. As mentioned, many Unix and Linux have a GUI built on top. Nevertheless, you will need to learn to use the command line to gain the full power of Unix or Linux.
While in a command line interface or terminal application, type “cal” or “date” (without the quotes). These are simple Unix commands that should display the date or a calendar.
-
5. Inexpensive Linux Computer: Raspberry Pi
What if you need Unix or Linux, but don’t have a computer or only have a Windows computer (that you don’t want to mess with)?
You can buy a Raspberry Pi computer for about US $35. The Raspberry Pi (or simply Pi) runs Linux and also comes with a graphical user interface (GUI). It probably won’t run heavy graphics video games, but it will run many useful programs and can be extremely useful for research programming.
The downside is that the US $35 only includes the computer itself. You need to supply a monitor, keyboard, mouse and power supply. Sometimes old keyboards and monitors, etc. will work with the Pi. Sometimes you can buy these things as part of an inexpensive package or order a small monitors and keyboard (which is what the author did), for a total of about US $100 for everything.
Resources
- Raspberry Pi organization
- Adafruit (commercial vendor)
- Sparkfun (commercial vendor)
-
6. The command line