This course concerns satellites and their imagery and remote sensing. Cubesats are introduced as a means to understanding more complex satellites. Methods for understanding and analyzing satellite images are discussed.
This course concerns satellites and their imagery and remote sensing. Cubesats are introduced as a means to understanding more complex satellites. Methods for understanding and analyzing satellite images are discussed.
Table of Contents
-
1. CubeSats
Introduction to CubeSats
A CubeSat(also called a NanoSat) is a small satellite, typically ranging from 10 cm³ to 20 cm x 20 cm x 30 cm. (Smaller satellites are called PocketSats or WaferSats).
CubeSats that orbit the Earth for at least one orbit are true satellites. (“Satellites” that merely probe the upper atmosphere or are carried by a balloon are technically not satellites even if they are called such by public relations departments). CubeSats face many of the same challenges as do larger satellites, and hence have some of the same sorts of systems.
NASA Ames nanosatellite launch (credit: NASA)
NASA’s first deep space cubesats (credit: NASA)
Crazy engineering: cubesats (credit: NASA)
CubeSats typically include the following systems:
- Frame (structure)
- Payload (sensors, camera, other)
- Controller (CPU)
- Power (typically photovoltaic cells and batteries)
- Communications and antenna
- Guidance and navigation
- Attitude control (and sometimes propulsion)
- Thermal control (may just be a roll)
Structure
CubeSats require a structure. These can be purchased pre-built. They are typically in cubes of preset multiples of 1.0 U, 0.5 U or 0.25 U. They need to be able to handle the temperature extremes of space, which typically requires metal or exotic plastics.
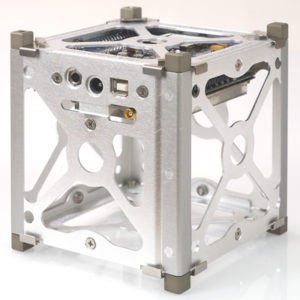
1U CubeSat (10 cm x 10 cm x 10 cm, credit Cubesatkit.com)
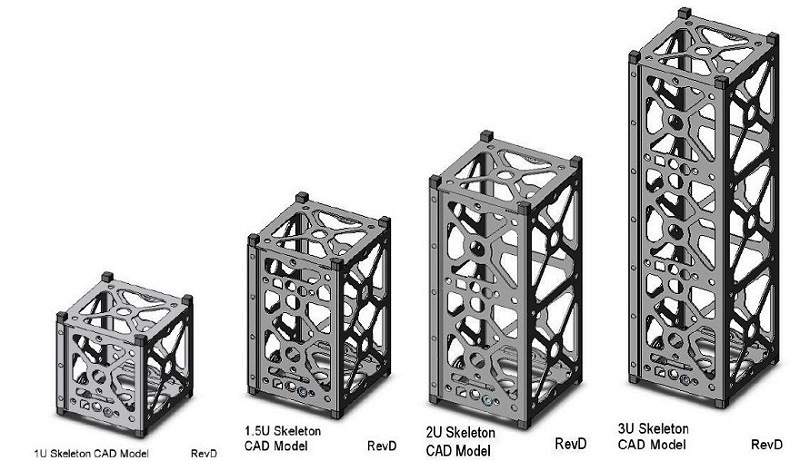
Various cube sat sizes
Antennas:
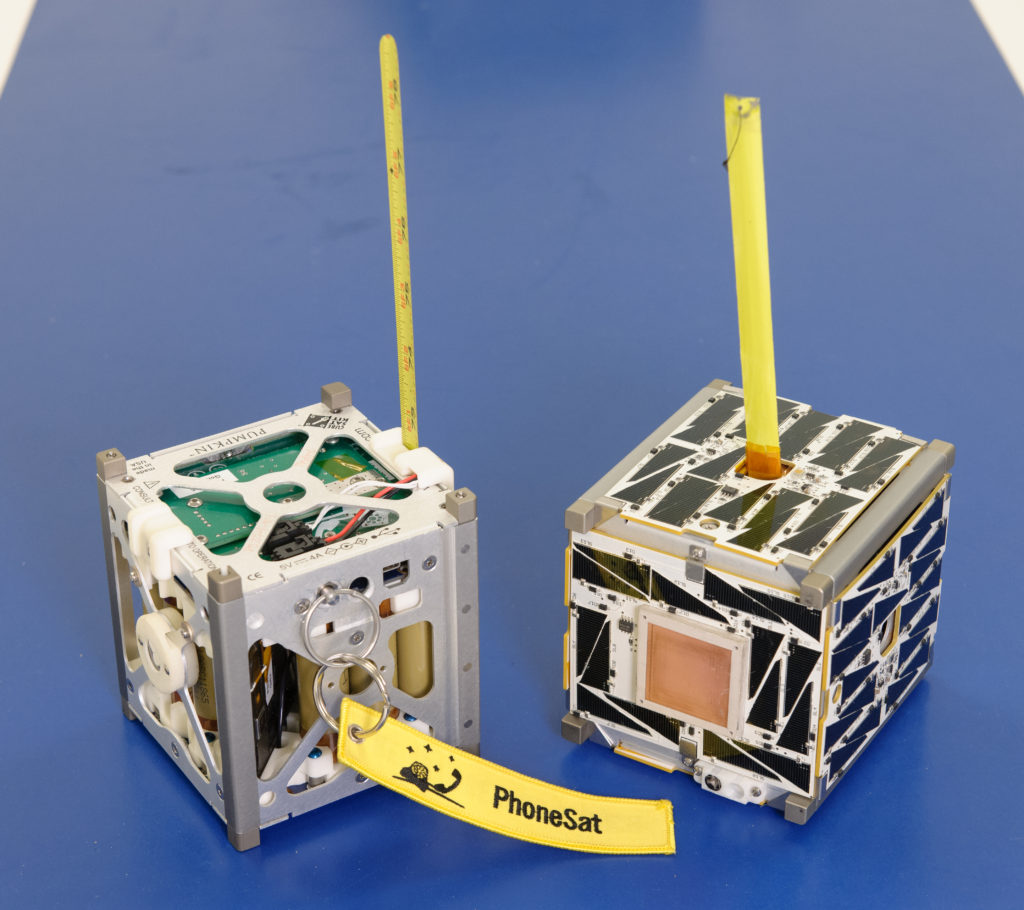
Actual CubeSats (credit: NASA)
Communications
Cube sats must communicate with ground stations on Earth using specific frequencies.
Deployment
Cube sats can be directly launched, or transported to the International Space Station (ISS) and deployed form there.
CubeSat Ventures
- Planet(Labs) constellation (bought Skybox) (ISU connections)
- Teton Systems(education)
- Koolock infrared multispectral
- Spire (ISU alumnus)
- AstroDigital
Suppliers
- Pumpkin cube sat kits and parts
Ground Stations
You will need at least one ground station to communicate with your cube sat.
- Univ. of Hawaii mobile modular ground station(pdf)
- CubeSat Ground Station at the University of Arizona(pdf)
- Make: Build Your Own Ground Station
- CubeSat Shop ground station kit
Further Information and Resources
- Deep Space cube sats(NASA Mars mission)
- CubeSatKit kits and parts
- CubeSat Shop parts and kits
- EnduroSat CubeSat Store
- Space Challenges
- SpacePort Academy
- An Introduction to CubeSats(Bob WB4SON – September 8, 2014)
- An Overview of CubeSats from a Systems Engineering Perspective(Zamora, et al.)
- Nanosatellite Development from a CubeSat Designer’s Perspective(Kalman)
- CubeSats and Mission Success: A Look at the Numbers(Michael Swartwout)
- Mechanical, Power, and Propulsion Subsystem Design for a CubeSat(Cote et al.)
- Small Satellites for Space Weather Research(Moretto et al.)
-
2. Obtaining, Processing and Analyzing Satellite Imagery
Learning Objectives
- Identify sources of satellite images
- Download and use several software packages to open, examine and process different types of images and remote sensing information.
Prerequisites
- Knowledge of computers and patience.
- Preferred: knowledge of how use a command line utility, especially for Linux/Unix.
Introduction
This workshop introduces several tools for examining, processing and analyzing satellite images. Having your own laptop will be beneficial, since you can download and install the applications and files during the workshop and help each other. Be warned that some of these files and applications are large. Having at least a few gigabytes of free disk space is a necessity.
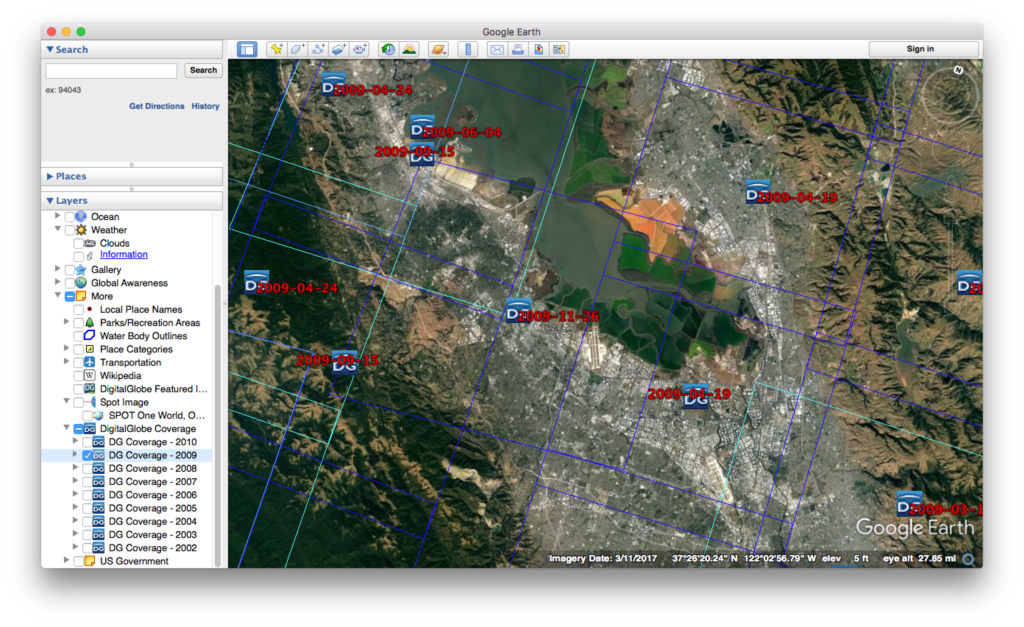
Google Earth
Google Earth provides an easy way to get free satellite imagery, although what is freely available is quite limited in terms of time frequency and resolution.
- Go to the Google Earth website and download Google Earth.
- Open Google Earth.
- Click on the button to the right of the magnifying glass to see panels.
- Choose the Layers panel to see available satellite images and sources.
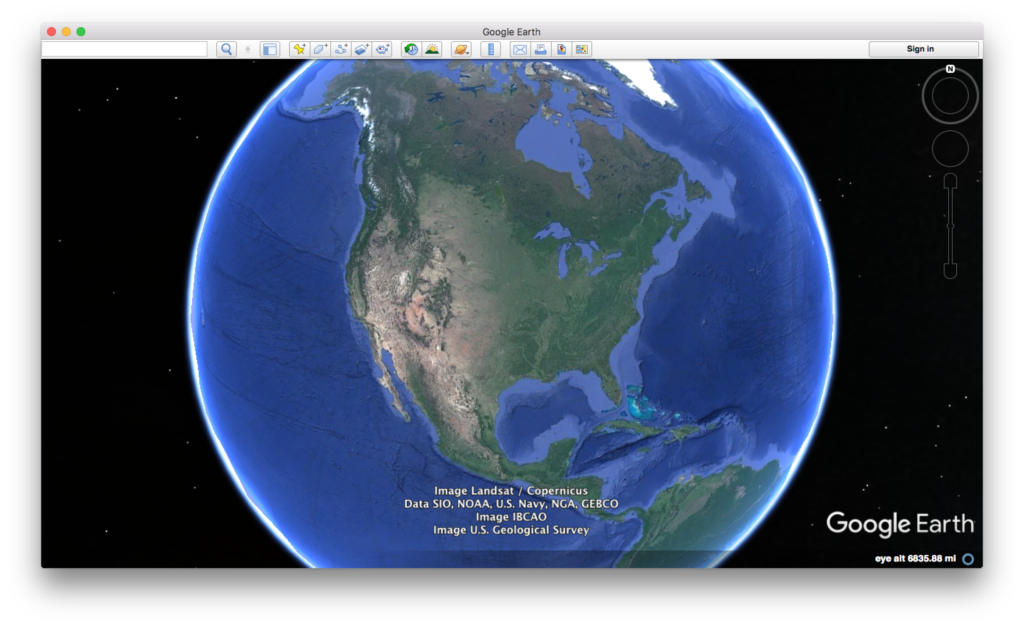
Credit: Google Earth
Credit: Google Earth
ESA Sentinal
There are five ESA Sentinel missions, each of which concentrate on different capabilities.
-
- First sign up for a Copernicus account using Open Hub.

Copernicus main page
- Let’s look at visible images (some infrared bands might be available)
- Install the Sentinel 2 – Toolbox
- Obtain an image through Copernicus.
- Load the image into the toolbox.
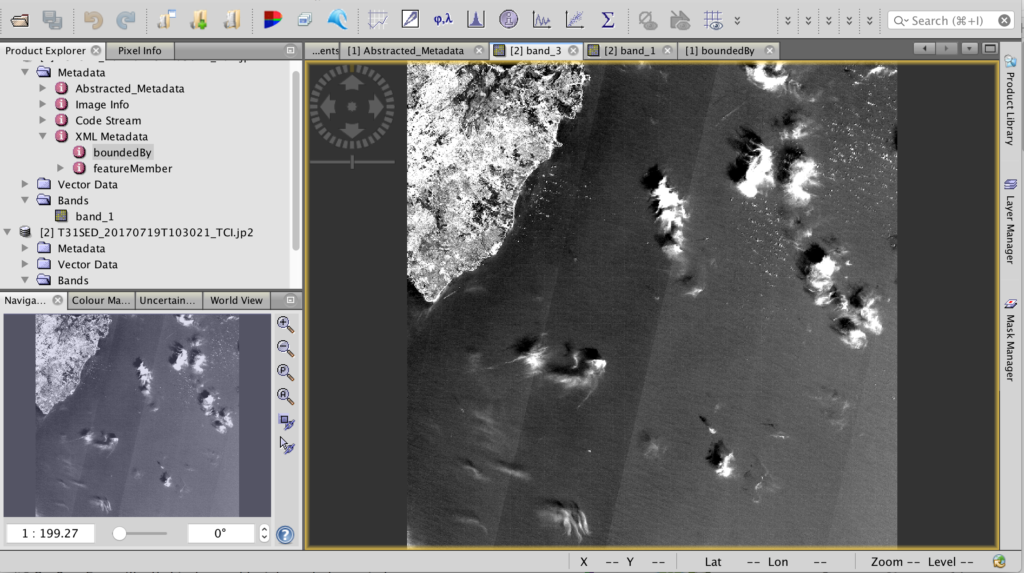
Sentinel Toolbox 2
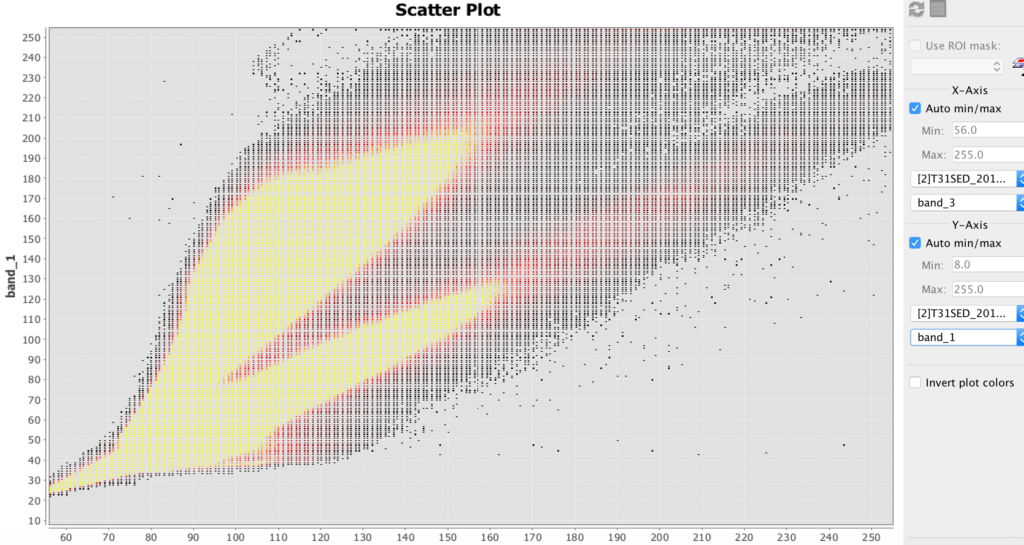
Sentinel Toolbox 2 scatter plot example
HDF
- HDF stands for hierarchical data file. It is used for some remote sensing files.
- Install HDFview for hierarchical data files (.h4, .h5, etc.)
- Download this file: BUV-Nimbus04_L3zm_v01-00-2012m0203t144121.h5.txt
- Open up this file in HDFview.
Processing Images Using Python
You can process images by using the Python programming language. The Python Image Library (PIL) makes some analysis relatively easy. UPDATE: this workshop is will be moving towards the PILLOW package, since PIL is no longer supported.
- Make sure that you have a text editor on your computer. It should be able edit and save pure text. Applications such as MS Word are not very good at this. Applications such as Xcode or Textmate are suitable.
- Make sure you have a terminal application on your computer. It might be called Terminal or HyperTerminal. If not, install a terminal program for your computer.
- Make sure that you have Python 1.5.2 or newer installed on your computer. To check, open your terminal application and enter python –version
- If you need to get or upgrade Python, click here.
- Download, uncompress and move the file to your working directory: PIL_test.py
- Run that file in your terminal with the command python PIL_test.py
- If the file says that PIL or Image are missing, download the library from here. (PIL installation can be challenging. Use Google to find additional sources of help for your operating system).
- PIL documentation can be found here.
- Download and unzip this file: Image_Processing_Example_01
- Run the file and practice changing the parameters. (See comments in file.)
Hyperspectral Images and Analysis
Hyperspectral allows you to determine the materials viewed with much greater precision than most other methods. The amount of hyperspectral imagery available (especially for free) is quite limited, but the quantities should greatly increase in the next few years due to new missions by Satellogic and Planetary Resources.
The best way to learn how to use hyperspectral images is to download the TNPmips GIS software and go through the hyperspectral tutorial on that site.
- TNTmips is GIS software that has a hyperspectral analysis component. There is a free version.
Historical Analysis With Remote Sensing
Introduction
Pyramids, palaces, great walls, entire ancient cities, and even Milwaukee’s Mitchell Park botanical domes…some people prefer their objects of material culture to be colossal! Numerous macro-material objects of historical interest can be observed utilizing satellite imagery and remote sensing. Many large geographic features, such as river areas and mountains have not changed greatly over time. Much in history can be illustrated and analyzed using satellite images, especially if one delves deeper than a mere visual sweep.
Fortunately, there has recently been a copious avalanche of freely-available satellite imagery by the National Aeronautics Space Administration, European Space Agency, Google and other parties. There is also an abundance of free tools and techniques that can greatly enhance the ability to employ such imagery to characterize large historical objects. There is even additional remote sensing data that allows historians to peer beneath the Earth’s surface down into the secrets of covered ruins. The digital historian merely peers: no digging is required!
Satellite Images
- The nature off of satellite images
- Types and components of satellite images and remote sensing data
- Specifications and limitations.
Sources
- Sources of free satellite imagery from government sources (Landsat, Sentinel, EOSDIS) and private sources (Google, Planet).
- Approaches to obtain proprietary imagery for free
- NASA Earthdata
- Earthdata Human Dimensions
- Human Dimensions data
- Earth Data visualization tool
- Moderate Resolution Imaging Spectroradiometer (MODIS) site
Tools
Easy-to-use, high-level tools to use and manipulate satellite imagery:
Image Analysis
Advanced image analysis and manipulation tools will be briefly introduced, such as Python image libraries, SNAP, HDF and TNTmips.
-
3. Spectral Analysis
The Electromagnetic Spectrum
A diagram of electromagnetic wavelengths and their types is shown below. Notice how the visible part of the spectrum is only a small part of the total spectrum.
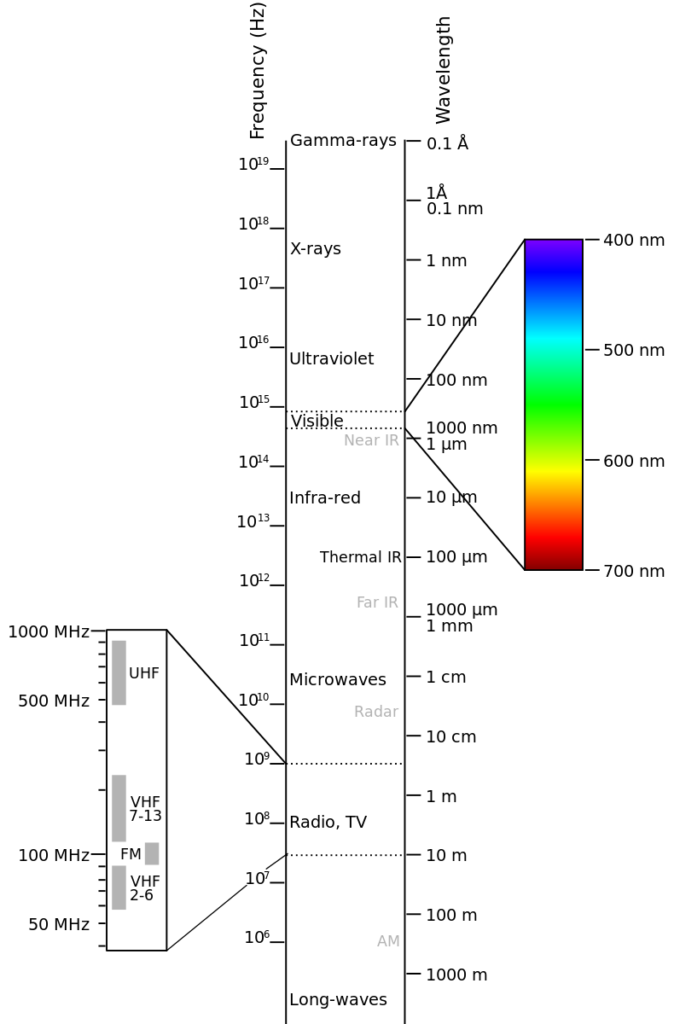
Electromagnetic spectrum
Types of Spectra
A spectrum is the brightness of light for each wavelength. Many substances exhibit a characteristic pattern of bright and dark parts of the spectrum. There are several types of spectra:
- Transmission: light emitted when electrons emit photons, typically from hot objects or gasses. Typically comprised of bright lines against a dark background. (Works best for hot, glowing objects or lights)
- Absorption: light absorbed by a fluid such as a gas or liquid. Typically comprised of reduced wavelength areas of brightness. (Works best for fluids, particularly in infrared)
- Reflectance: light reflected by an object or area. Will typically appear darker for some wavelengths. (Often best approach for observing solid objects, or ground/water from above; e.g. for geology)
Spectral Options
Need to determine what wavelengths we need to observe: visible, Infrared, UV?
- Diffraction grating (transmission)
- Diffraction grating (reflection)
- Piece of CD (inexpensive, but quality may be insufficient)
- Prism
- Tunable filter
- Multiple detector/filter combinations
- iPhone spectrometer? (but would need an iPhone for each sensor!)
Water Spectrum (NIST)
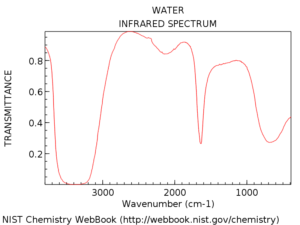
absorption spectrum for water (NIST)
- NIST water page
- HDF group HDF5 Software
Reference
Spectral grating tutorial (ThorLabs)
-
4. Hyperspectral Imagery and Analysis
Whereas most satellites have between 4 to 6 broad spectral bands (such as blue, green, red, near infrared), multispectral satellites might have between 10 to 25 bands. A true hyperspectral satellite can sense enough narrow bandwidth bins to be able to identify the chemical spectral signature of each pixel in an image, which might be anywhere from 100 to 300 narrow spectral bands.
There are not many hyperspectral satellites. One reason is that the optics are extremely challenging. Another reason is that the more data needs to be transmitted back to the Earth than can be accommodated by space-to-Earth communications systems.
Hyperspectral analysis software typically involved comparing hyperspectral data to chemical signature libraries on a spatial basis. A major challenge for such analysis is calibration,
Hyperspectral Satellites
- Satellogic hyperspectral satellites
- Planetary Resources Arkyd6 satellites (planned)
- Hypercubes (planned)
Hyperspectral Cameras
- Commercial
- Non-Commercial/Research
- SUCHI: The Space Ultra-Compact Hyperspectral Imager for small satellites; this might be useful where there is not much room for a camera.
Relevant Optics
- SemRock. Tunable filters (downloadable introduction).
- Wikipedia. Liquid Crystal Tunable Filter (LCTF) introduction.
- ThorLabs. Liquid Crystal Tunable Filter (LCTF) product.
- Resonon benchtop systems.
- Ocean Optics modular spectrometers.
Hyperspectral Software
- Resonon Spectronon software.
- Hyperspectral Image Analysis Toolbox (HIAT). Uses MATLAB.
- ERDAS IMAGINE spectral analysis
- Hyperspectral IR analysis module for MUSES.
- TNTmips. Software for hyperspectral analysis and geospatial analysis, GIS.
- Hyperspectral analysis in R.
- NemaPlot.
- Exelis VIS (works with ArcGIS). Tutorial.
- U. of Manchester (D.F. Foster) MatLAB routines and tutorial.
- Kakadu JPEG software development (not specifically for hyperspectral)
- DSP TSC21020E (a high-reliability version of the ADSP21020) compression software.
Optical Support Equipment
Hyperspectral data and libraries
- USGS Digital Spectral Library (reflectance)
- Scyllarus (NICTA). Miscellaneous objectstaken from the ground.
- AVERIS data (includes Moffett Field data)
Conferences & Events
- Hyperspectral Imaging and Sounding of the Environment (HISE), 1-4 March 2015 California.
More Information And Reference
- ASDI. Spectral Remote Sensing
- Microimages hyperspectral data.
- NASA SpinOffs article.
- AGI(download).
- Lossy compression Google search.
News
-
5. Environmental Analysis & GIS
Environmental Remote Sensing
- GOSATCO2project
- NASA CO2Measurements at night using lasers
- NASA OCO-2CO2monitoring satellite
- NASA soil moisture SMAP
- NASACO2 from humans
- Satellite data(Alaska)
- SMAP (soil moisture) data
- ESA Copernicus space component data accessportal
- ESA Sentinel(free data: some global, some just Europe)
GIS Software and Information
- QGISopen source GIS software – downloads
- TNT MIPSfree GIS software with hyperspectral component – downloads
-
6. Historical Analysis With Remote Sensing and GIS
Introduction
Pyramids, palaces, great walls, entire ancient cities, and even Milwaukee’s Mitchell Park botanical domes…some people prefer their objects of material culture to be colossal! Numerous macro-material objects of historical interest can be observed utilizing satellite imagery and remote sensing. Many large geographic features, such as river areas and mountains have not changed greatly over time. Much in history can be illustrated and analyzed using satellite images, especially if one delves deeper than a mere visual sweep.
Fortunately, there has recently been a copious avalanche of freely-available satellite imagery by the National Aeronautics Space Administration, European Space Agency, Google and other parties. There is also an abundance of free tools and techniques that can greatly enhance the ability to employ such imagery to characterize large historical objects. There is even additional remote sensing data that allows historians to peer beneath the Earth’s surface down into the secrets of covered ruins. The digital historian merely peers: no digging is required!
Satellite Images
- The nature off of satellite images
- Types and components of satellite images and remote sensing data
- Specifications and limitations.
Sources
- Sources of free satellite imagery from government sources (Landsat, Sentinel, EOSDIS) and private sources (Google, Planet).
- Approaches to obtain proprietary imagery for free
- NASA Earthdata
- Earthdata Human Dimensions
- Human Dimensions data
- Earth Data visualization tool
- Moderate Resolution Imaging Spectroradiometer (MODIS) site
Tools
Easy-to-use, high-level tools to use and manipulate satellite imagery:
Image Analysis
Advanced image analysis and manipulation tools will be briefly introduced, such as Python image libraries, SNAP, HDF and TNTmips
GIS
Finally, Geographical Information System (GIS) platforms will be explored. Open-source QGIS will be demonstrated.
Cloud-based software, such as QGIS cloud, and cloud-based Map Editor will also be demonstrated.
Tryouts
Try out some of the platforms and tools in the workshop and make their own amazing discoveries. Participants will benefit from bringing their own laptop (ideally with a spreadsheet program installed and working wireless connectivity), but there will be activities that do not require technology.
https://www.mining-technology.com/projects/bingham/
https://www.google.com/maps/place/Bingham+Copper+Mine/@40.5321555,-112.1425017,9109m/data=!3m1!1e3!4m5!3m4!1s0x875299fbf94e3949:0xc450bdb3d868069f!8m2!3d40.5221684!4d-112.1493862
ANCIENT CHINA: SATELLITE AND DRONE IMAGERY OF PREHISTORIC SILK ROAD CORRIDOR REVEALS LONG-LOST IRRIGATION NETWORK
http://www.newsweek.com/ancient-china-irrigation-system-traveled-silk-road-corridor-satellite-drone-769482
Historical Map Collection
http://dsr.nii.ac.jp/geography/index.html.en
http://dsr.nii.ac.jp/geography/blue-marble/