Advanced Visualization
Graphics Generation with SVG
By Mark Ciotola
First published on February 27, 2019
Scalable Vector Graphics (SVG) is a language that can produce graphics. It works best to produce graphics with lines and shapes rather than photographic image. It works well to produce network diagrams.
The following is an example of SVG that will display a simple network diagram.
[code lang=”html” firstline=”1″]
<svg width=”300″ height=”100″>
<circle cx=”50″ cy=”50″ r=”40″ stroke=”black” stroke-width=”4″ fill=”cyan” >
<circle cx=”200″ cy=”50″ r=”40″ stroke=”black” stroke-width=”4″ fill=”cyan” >
<line x1=”50″ y1=”50″ x2=”200″ y2=”50″ stroke=”blue” stroke-width=”2″>
</svg>
[/code]
Below is a network diagram for geographic areas.
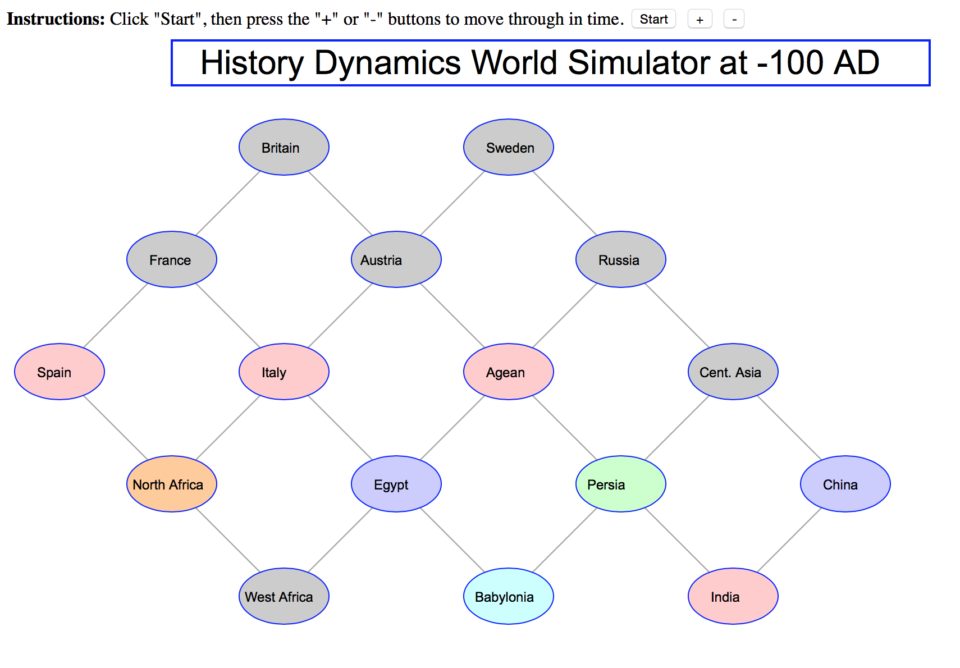
History grid (PHP/SVG)
Resource
- w3schools.com SVG Tutorial