Digital History
Geographical Information Systems
By Mark Ciotola
First published on February 27, 2019
Objectives
- Students will learn about geographical information systems as a tool to bring together various information sources to provide a better spatial understanding and visualization of historical phenomena.
- Finally, Geographical Information System (GIS) platforms will be explored. Open-source QGIS will be demonstrated.
- Cloud-based software, such as QGIS cloud, and cloud-based Map Editor will also be demonstrated.
Geographical Information Systems (GIS)
Geographical Information Systems (GIS) are ways to store, view and analyze information concerning areas of the Earth’s surface, such as a neighborhood, region, country or continent. They can even be used for oceans and even other planets.
GIS can be used to create maps, territorial diagrams and visualizations and even perform analysis. A software platform must be used for GIS. There are proprietary GIS platforms with lots of features such as ArcGIS. They cost money, but your university might have a subscription that you can use. You can sometimes get a free trial copy. There are also “open source” or lite versions that you can get for free, such at MIPS or QGIS. It is strongly recommended to go through the tutorial for at least one platform. Most platforms are somewhat similar, so if you know one platform reasonably well, then the others will make much more sense.
GIS breaks spatial information down into layers. For example, a base layer might comprise a satellite image. Another layer might superimpose roads and buildings. Another layer might contain labels and annotation. You might import a layer, such as the satellite image, then manually create other layers such as the annotation. There are many types of layers that you can import, sometime from the platform vendor, but often from other sources such as government sites.
Remember that the Earth is not flat! So unless you are working with a small area on the Earth’s surface, you will need to take into account the curvature of the layers you import or add. The larger the area, the greater the curvature becomes. Most GIS platforms will let you choose a coordinate system, but then you must make certain that the other lays will work with it.
Below is an example showing a map with the Hawaiian Island chain in the Pacific Ocean. To the left is a panel showing the available layers. You can choose which layers to display by checking them. Here, the counties (representing islands), cities and urban area layers have been selected. To the right, you can see those layers displayed. At the lower right hand corner, you can see the selected coordinate system.
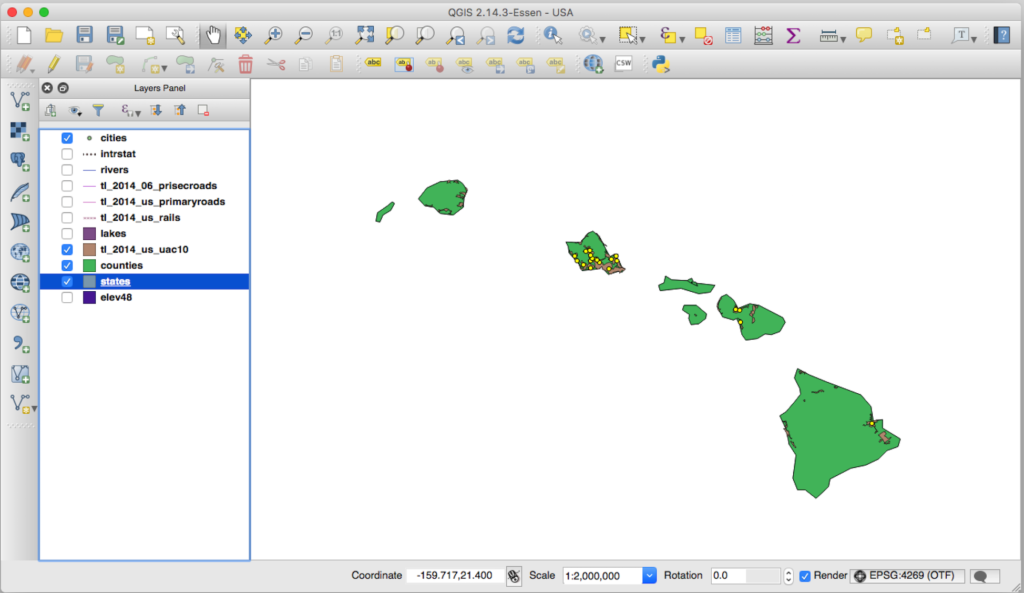
GIS view of Hawaii with cities and urban areas emphasized (QGIS)
Tryouts
Try out some of the platforms and tools in the workshop and make their own amazing discoveries. Participants will benefit from bringing their own laptop (ideally with a spreadsheet program installed and working wireless connectivity), but there will be activities that do not require technology.
GIS Software and Information
- QGIS open source GIS software – downloads
- TNT MIPS free GIS software with hyperspectral component – downloads
Activity
- Students will get as far as they can through a standard GIS tutorial in the time available.
Resources
- ArcGIS Story Maps.
« Satellite Imagery for Historical Uses | COURSE | Computational History and Simulations »