Digital History
Satellite Imagery for Historical Uses
By Mark Ciotola
First published on February 27, 2019
Learning Objectives
- Students will learn about how both current and semi-historical (past 65 years) satellite imagery can be used to for historical purposes, such as locating and examining historical remains of past societies as well as current/recent regional terrains.
- Students will learn the capabilities and limitations of satellite imagery, how to obtain imagery, how to process it and analyze it.
- Identify sources of satellite images
- Download and use several software packages to open, examine and process different types of images and remote sensing information.
Prerequisites
- Knowledge of computers and patience.
- Preferred: knowledge of how use a command line utility, especially for Linux/Unix.
Introduction
Obtaining, processing and analyzing satellite imagery for can be a valuable toolset for historians. It allows you to literally be an armchair archeologist. It also gives you some idea of what the geographical features are of a historical region (with the caveat that sometimes that changes over time).
This workshop introduces several tools for examining, processing and analyzing satellite images. Having your own laptop will be beneficial, since you can download and install the applications and files during the workshop and help each other. Be warned that some of these files and applications are large. Having at least a few gigabytes of free disk space is a necessity.
Google Earth
Google Earth provides an easy way to get free satellite imagery, although what is freely available is quite limited in terms of time frequency and resolution.
- Go to the Google Earth website and download Google Earth.
- Open Google Earth.
- Click on the button to the right of the magnifying glass to see panels.
- Choose the Layerspanel to see available satellite images and sources.
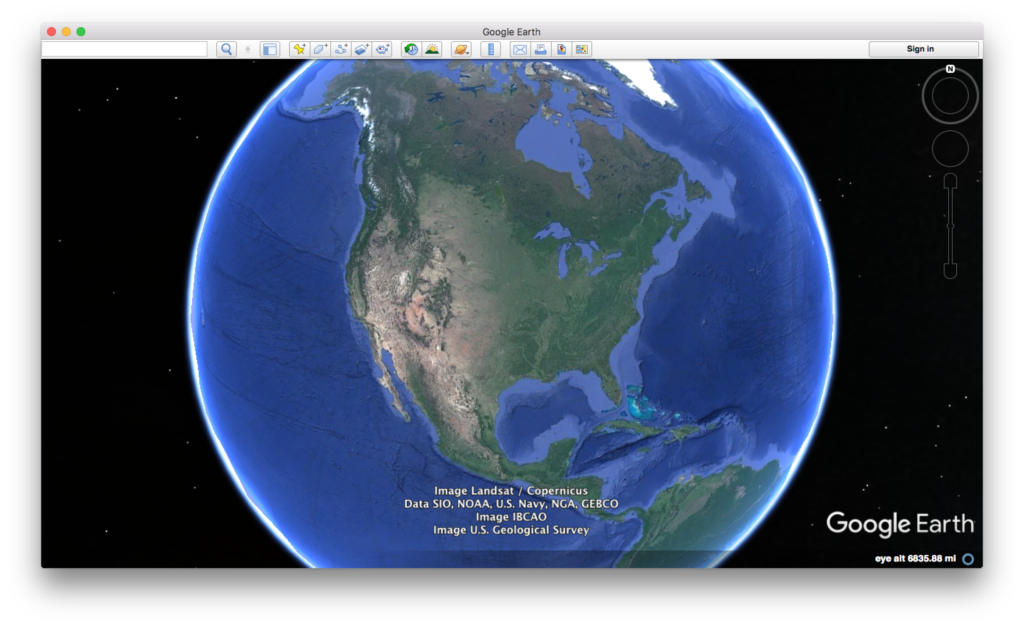
Credit: Google Earth
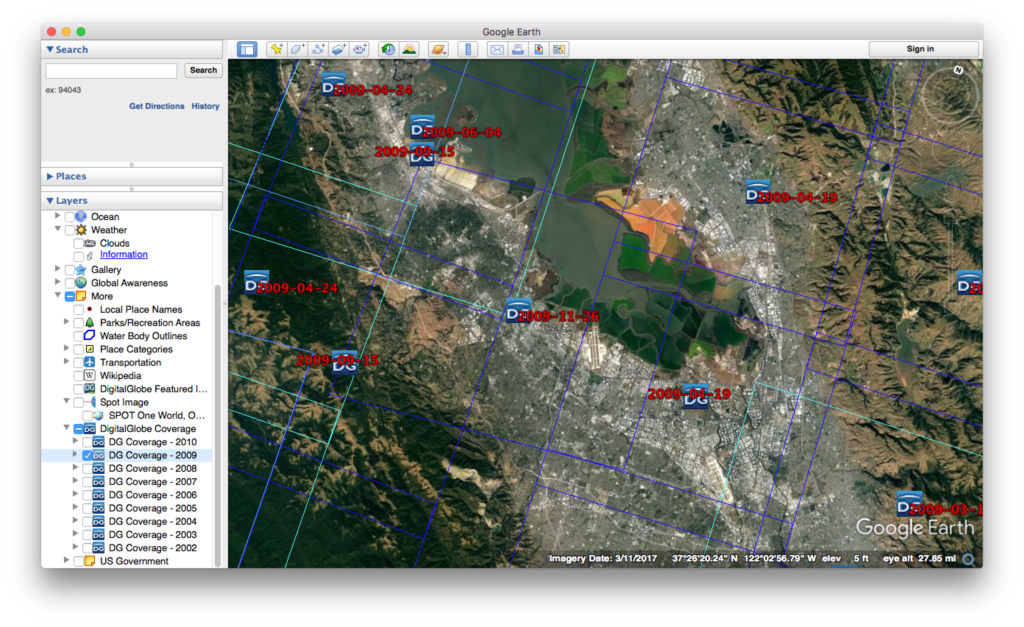
Credit: Google Earth
ESA Sentinal
There are five ESA Sentinel missions, each of which concentrate on different capabilities.
-
- First sign up for a Copernicus account using Open Hub.

Copernicus main page
- Let’s look at visible images (some infrared bands might be available)
- Install the Sentinel 2 – Toolbox
- Obtain an image through Copernicus.
- Load the image into the toolbox.
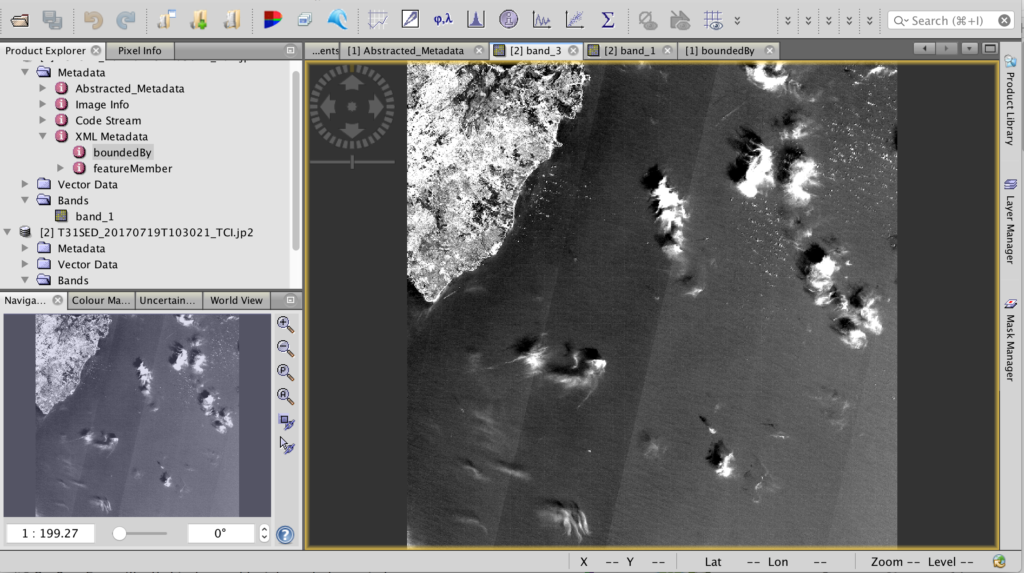
Sentinel Toolbox 2
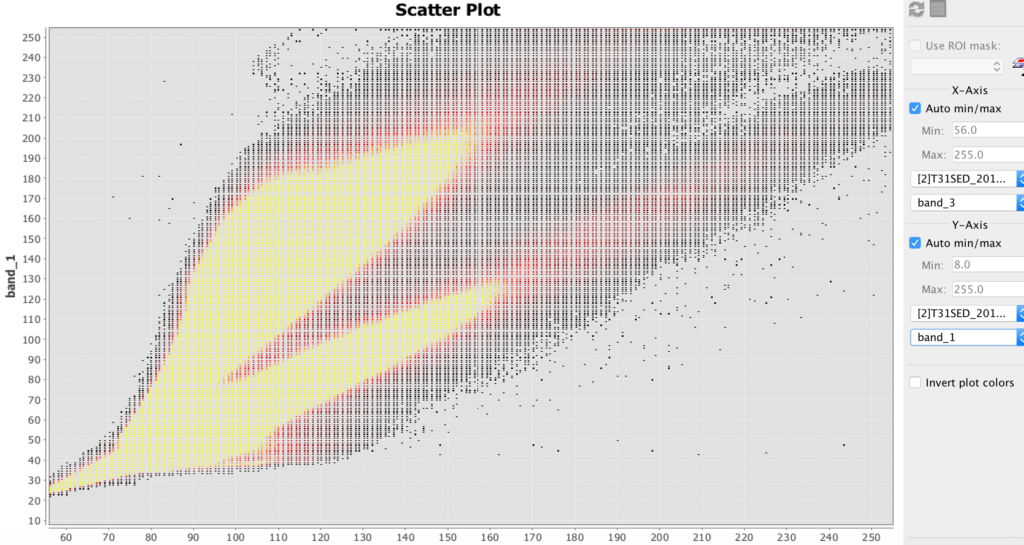
Sentinel Toolbox 2 scatter plot example
HDF
- HDF stands for hierarchical data file. It is used for some remote sensing files.
- Install HDFviewfor hierarchical data files (.h4, .h5, etc.)
- Download this file: BUV-Nimbus04_L3zm_v01-00-2012m0203t144121.h5.txt
- Open up this file in HDFview.
Hyperspectral Images and Analysis
Hyperspectral allows you to determine the materials viewed with much greater precision than most other methods. The amount of hyperspectral imagery available (especially for free) is quite limited, but the quantities should greatly increase in the next few years due to new missions by Satellogic and Planetary Resources.
The best way to learn how to use hyperspectral images is to download the TNPmips GIS software and go through the hyperspectral tutorial on that site.
- TNTmipsis GIS software that has a hyperspectral analysis component. There is a free version.
Further Reading
- Cubesats and Satellite Imagery (Corsbook)
« Using Image Processing to Gain Superhero Vision | COURSE | Geographical Information Systems »