Learning Objectives
Create 3D scatterplots
Demonstration
Here is the dataset that we are using in this demo:
This dataset is about Down’s Syndrome in Canada. (I have slightly modified the original dataset for our purpose).
https://vincentarelbundock.github.io/Rdatasets/doc/boot/downs.bc.html
We will first import the dataset. Then we will generate a 3D scatterplot from the dataset downs_bc. See below for details.
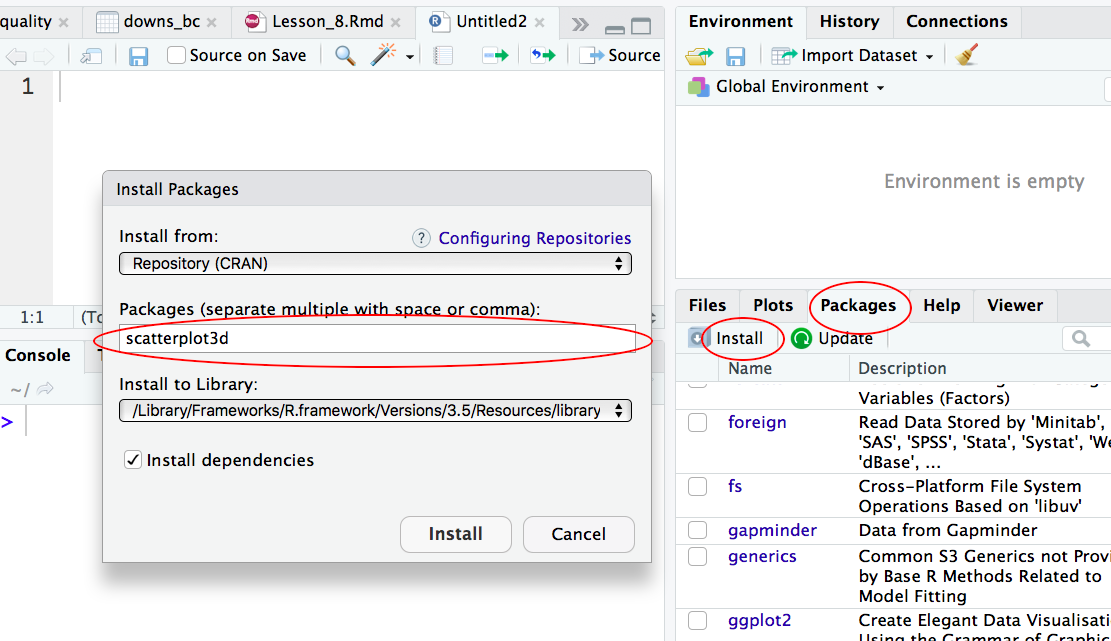
Step 1: Install the R package “scatterplot3d”
Two ways to install a R package one way is to type install.packages(scatterplot3d); the other way is to install via the graphical interface of RStudio:
Step 2: Install the R package “scatterplot3d”
Before we can use the R package to create 3D scatterplots, we need to load the package into R first:
> library(scatterplot3d)
Step 3: Create a 3D scatterplot
Our dataset is called downs_bc. We want to generate a 3D scatterplot for the three columns in that dataset: cases, age and births.
> library(scatterplot3d)
> with(downs_bc,
+      scatterplot3d(cases ~ age + births, pch = 19,
+                    main="Incidence of Down's Syndrome",
+                    xlab="Age", ylab="Cases", zlab="Births"))
Explanation:
We use the library function to load the R package “scatterplot3d“.
Then we use generate the 3D scatterplot from the databset downs_bc:
cases ~ age means that the variable cases is explained by age (i.e. age is the explanatory variable);
+ births means that the variable births is the third variable in this scatterplot;
pch = 19 means to use plotting symbol 19 (solid circle) in our plot. (Type ?pch at the prompt to find out more about pch.)
Here is the 3D scatterplot: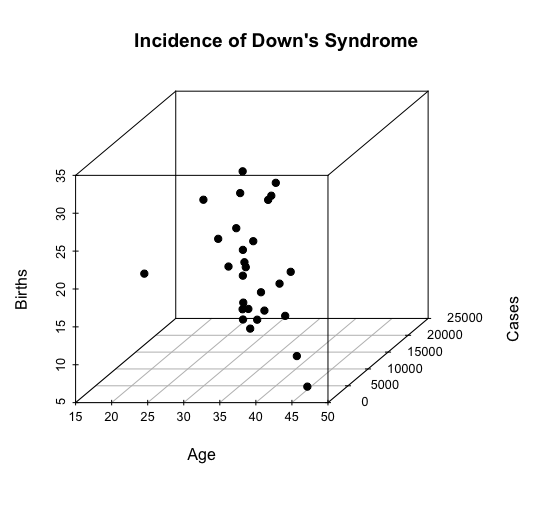
-END-